Bring sources together
I processed data from multiple sources and aggregated records into measures for reporting.
Business intelligence
I brought data from several sources into interactive reports so a reader could follow KPIs and trends.
Try the exampleInteractive example · Sample data
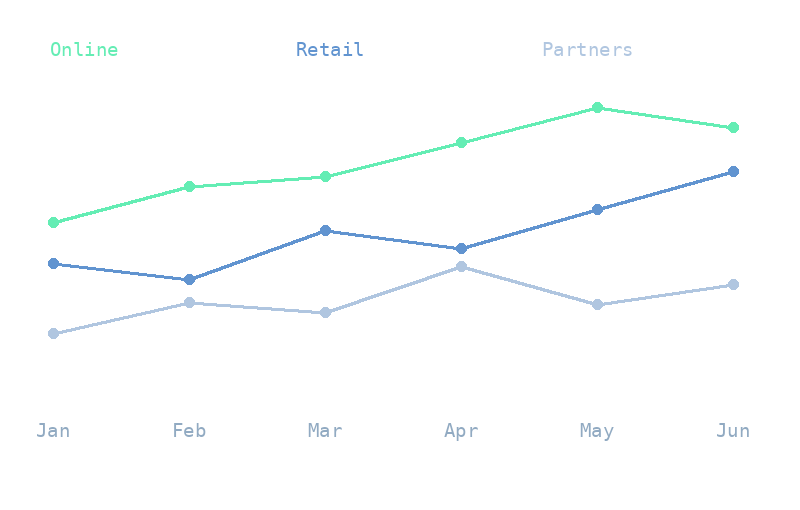
Explore six months of fictional orders. Changing the channel recalculates the totals and reveals which month was busiest for that channel.
Coursework
Business Intelligence & Big Data Analytics and Visualization
I processed data from multiple sources and aggregated records into measures for reporting.
I designed interactive Power BI views so stakeholders could explore key performance indicators and look for trends.
I used business-oriented reports to explain patterns and present recommendations to a non-technical audience.